Air Masses
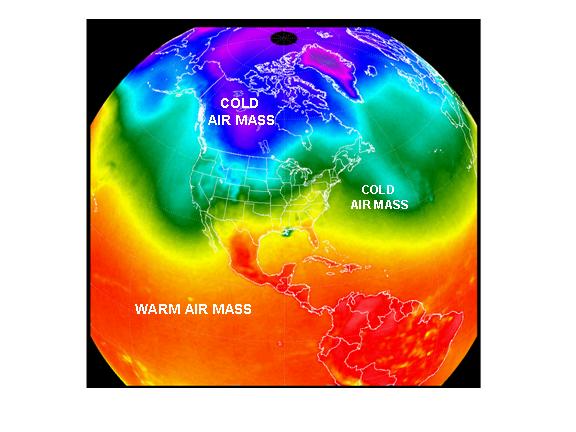
An air mass is a large body of air with a relatively uniform temperature, humidity, and pressure. Factors like temperature, humidity, and pressure affect the density of an air mass and can cause two air masses from mixing. So an air mass tends to move as a unit by itself. It travels under or around other air masses. As you can see by the photo below air masses cover thousands of square miles.
Classes of Air Masses

Maritime tropical: ( mT) masses that form over the oceans of the tropics ( warm humid weather)
Continental tropical: (cT) masses that form over a desert or tropical land area ( hot dry weather)
Maritime Polar: (mP) masses that form over the oceans of the arctic regions ( cool wet weather)
Continental Polar: ( cP) massed that start over cold land areas ( cold dry weather)
Arctic : masses that form over the snow and ice portions of the Arctic ( bitterly cold weather)
Front: The long line of storms that form where two air masses meet. ( such as in a "battle front)

Cold Front: A mass of cold air that moves into the territory covered by a mass of warmer air.

Warm Front: A mass of warm air that moves into the territory of a cold air mass.

Stationary Front: When neither air mass can displace the other.

Occluded Front: A cold front that has overtaken a warm front. Usually forms a Y.
Index Cards ( for memory work): http://www.esf.edu/erfeg/endreny/courses/for338/slides/for338-12-AirmassesFronts6.pdf
http://cimss.ssec.wisc.edu/wxwise/class/frntmass.html ( simple easy to understand)
http://www.uwsp.edu/geo/faculty/ritter/geog101/textbook/weather_systems/air_masses.html
http://www.tpub.com/content/aerographer/14312/css/14312_89.htm We will be using a map with this site to locate the frontal areas.
How To Read A Weather Map


As we have been going through the different topics on weather we have been learning how to read a weather map. The below charts are from NOAA. Makes it very easy to understand.

WEATHER
A weather symbol is plotted if at the time of observation, there is either precipitation occurring or a condition causing reduced visibility.
Below is a list of the most common weather symbols:

WIND
Wind is plotted in increments of 5 knots (kts), with the outer end of the symbol pointing toward the direction from which the wind is blowing. The wind speed is determined by adding up the total of flags, lines, and half-lines, each of which have the following individual values:
Flag: 50 kts
Line: 10 kts
Half-Line: 5 kts
If there is only a circle depicted over the station with no wind symbol present, the wind is calm. Below are some sample wind symbols:

PRESSURE
Sea-level pressure is plotted in tenths of millibars (mb), with the leading 10 or 9 omitted. For reference, 1013 mb is equivalent to 29.92 inches of mercury. Below are some sample conversions between plotted and complete sea-level pressure values:
410: 1041.0 mb
103: 1010.3 mb
987: 998.7 mb
872: 987.2 mb
PRESSURE TREND
The pressure trend has two components, a number and symbol, to indicate how the sea-level pressure has changed during the past three hours. The number provides the 3-hour change in tenths of millibars, while the symbol provides a graphic illustration of how this change occurred. Below are the meanings of the pressure trend symbols:

SKY COVER
The amount that the circle at the center of the station plot is filled in reflects the approximate amount that the sky is covered with clouds. Below are the common cloud cover depictions:

http://www.srh.noaa.gov/jetstream/synoptic/wxmaps.htm
http://dstreme.comet.ucar.edu/extras/wxsym.html
http://ww2010.atmos.uiuc.edu/(Gh)/guides/mtr/fcst/home.rxml
http://www.weather.com/newscenter/fcstsummary.html?from=wxcenter_news
http://mapmaker.meteor.wisc.edu/~jbrunner/ackerman/introduction/intro0.html
The Weather Book by Michael Oard
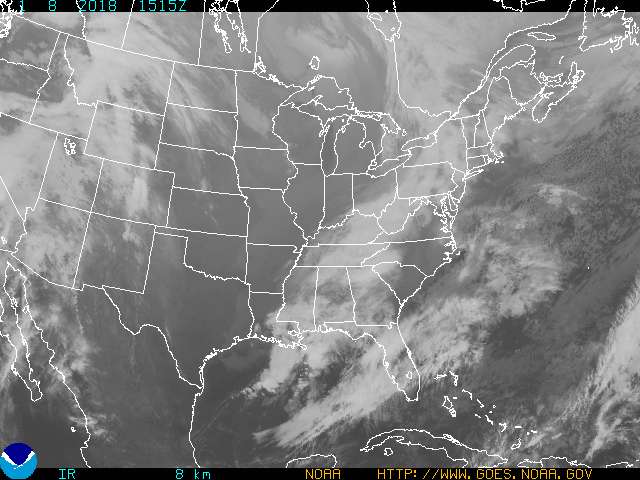
Studying Satellite Images
This is lots of fun to do. Once your kids are familiar with fronts, jet streams, and ocean currents they can really appreciate looking at these images.
No comments:
Post a Comment